Simcenter Amesim | Seeroutenplanung und Geschwindigkeitsvergleich
Maritime Simulation – Seeroutenplanung und Geschwindigkeitsvergleich
Maritime Simulation – Seeroutenplanung und Geschwindigkeitsvergleich
Die steigenden Kraftstoffpreise und der fortwährende Druck, die Umweltauswirkungen zu minimieren, machen die Reduzierung des Kraftstoffverbrauchs zu einer der größten Herausforderungen im maritimen Sektor. Simcenter Amesim-Modelle können sowohl im Konstruktionsprozess zur Bewertung von Antriebsalternativen als auch während des Betriebs zur Analyse verschiedener Seerouten unter Berücksichtigung der Wetterbedingungen eingesetzt werden.
Beispiele für Konstruktionsvergleiche

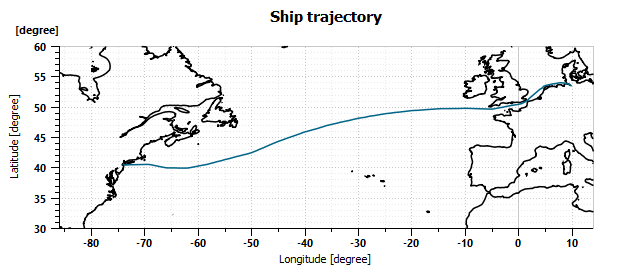
Abbildung 1: Schiffsroute vom Hafen Hamburg nach New Jersey
Dieser Artikel zeigt ein Beispiel, wie Simcenter Amesim während des Betriebs unterstützen kann. Ein Frachtschiff steht kurz vor der Abfahrt aus dem Hafen Hamburg mit dem Ziel New Jersey. Für die Reiseplanung sind folgende Fragen zu klären:

Im Simcenter Amesim wird ein Modell des Schiffs erstellt (Abbildung 2). Die Hauptkomponenten sind:
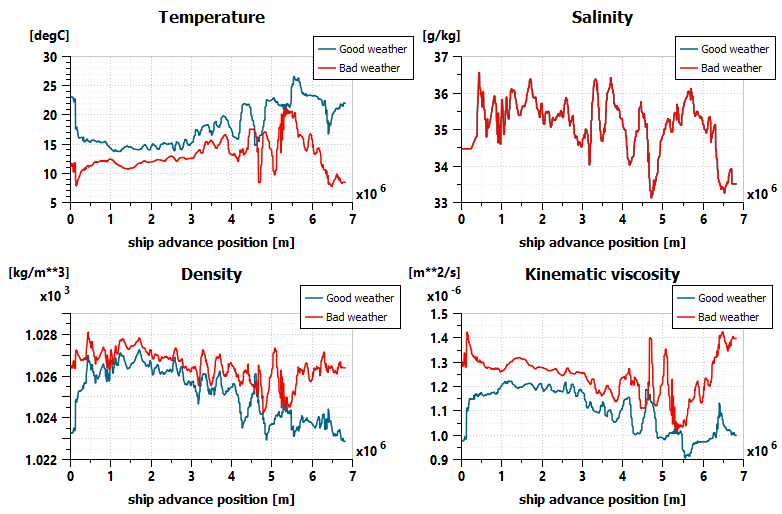
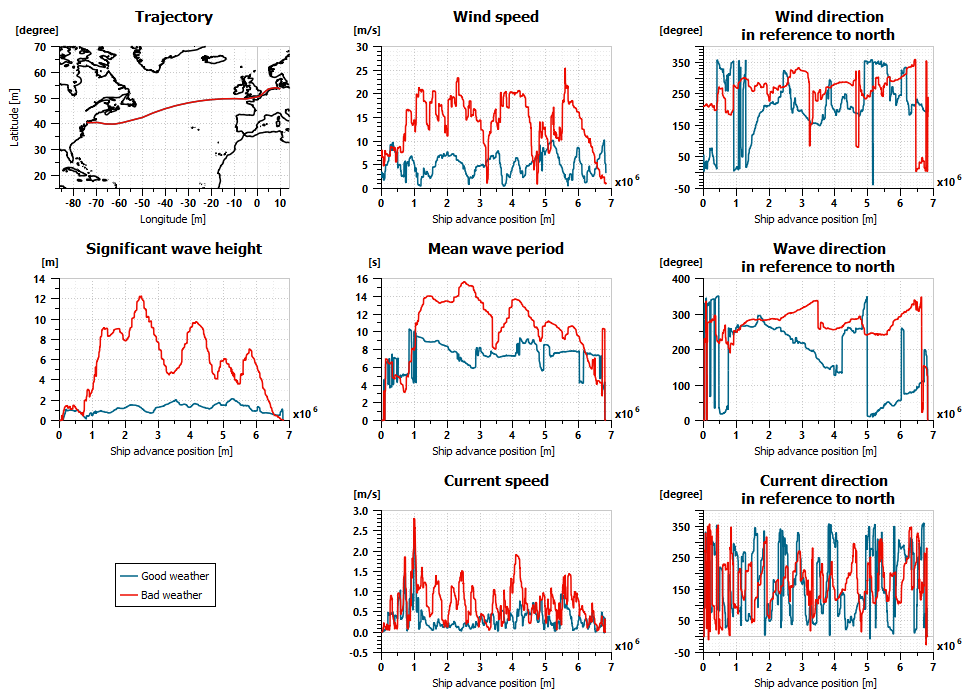
Entlang der Seewegstrecke werden unterschiedliche Seebedingungen berücksichtigt, indem zwei repräsentative Wetterbedingungen (gut und schlecht) angewendet werden. Diese Stufen wurden auf Grundlage des durchschnittlichen Wetters, das während der Reise auftreten kann, festgelegt und in zwei Extremniveaus unterteilt. Abbildung 3 und 4 zeigen die unterschiedlichen Bedingungen.

Abbildung 3: Seewassereigenschaften bei gutem und schlechtem Wetter

Abbildung 4: Wind- und Welleneigenschaften bei gutem und schlechtem Wetter
Drei verschiedene Sollgeschwindigkeitsprofile werden vorgegeben. Basierend auf den zwei erwarteten Wetterbedingungen und drei unterschiedlichen Reisegeschwindigkeiten werden insgesamt sechs Simulationen durchgeführt, um die Reisezeiten, den Kraftstoffverbrauch und die CO₂-Emissionen zu bestimmen. Abbildung 5 zeigt die tatsächliche Schiffsgeschwindigkeit im Vergleich zur Sollgeschwindigkeit. Bei guten Wetterbedingungen folgt die tatsächliche Geschwindigkeit den Sollgeschwindigkeiten von 8 und 11 Knoten. Bei der maximalen Sollgeschwindigkeit jedoch wird die tatsächliche Geschwindigkeit nicht erreicht, da die maximale Belastung des Schiffsantriebs erreicht wird. Bei schlechten Wetterbedingungen fällt die tatsächliche Höchstgeschwindigkeit sogar unter 11 bzw. 8 Knoten entlang der Route.

Abbildung 5: Vorgegebene Geschwindigkeitsprofile und tatsächliche Schiffsgeschwindigkeiten

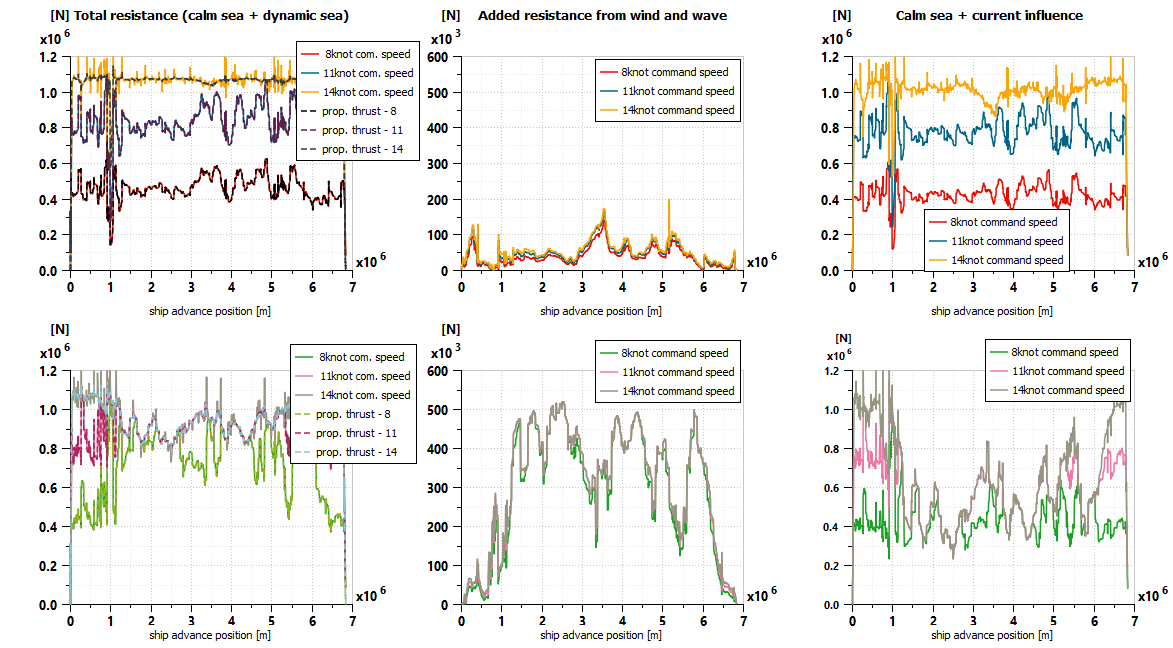
Abbildung 6: Seewiderstände aus verschiedenen Quellen bei gutem (oben) und schlechtem Wetter (unten)
Die Beschleunigung des Schiffs ergibt sich aus der resultierenden Kraft geteilt durch die Masse. Diese ergibt sich aus der Differenz von Widerstand und Propellerschub. Die wirkenden Kräfte sind in Abbildung 6 dargestellt.
Die Reisezeit, der gesamte Kraftstoffverbrauch und die CO₂-Emission werden für die sechs Simulationen bestimmt. Abbildung 7 zeigt, wie sich diese Werte entlang der Schiffsposition entwickeln. Die variierenden Geschwindigkeiten bei schlechten Wetterbedingungen sind deutlich im Diagramm zur Reisezeit erkennbar, da die Steigungen nicht konstant sind.
Die Zunahme der Reisezeit und des durchschnittlichen Kraftstoffverbrauchs sind in der Tabelle dargestellt.
[table id=2 /]
Benötigen Sie Information oder möchten Sie mit uns über Ihr Projekt sprechen? Nehmen Sie jeder Zeit Kontakt zu uns auf, gerne beantworten wir alle Ihre Fragen.
Bei Femto Engineering unterstützen wir Firmen dabei, ihre innovativen Projekte zu verwirklichen: mit Engineering, Training, Support, F&E und SDC Verifier.
Wir sind in den Benelux Ländern lizensierter Händler für Simcenter Femap, Simcenter Simcenter 3D, Simcenter Amesim und Simcenter STAR-CCM+. Melden Sie sich bei uns und lassen Sie die FEM und CFD Tools für sich arbeiten.
Melden Sie sich für unseren Newsletter an, um kostenlose Ressourcen, News und Updates monatlich in Ihrem Posteingang zu erhalten. Teilen Sie unser Fachwissen!